
The Art of Deception, Lighthouse Score Edition

A few very interesting discussions on Twitter have led me to understand that some folks are talking about Lighthouse scores in a way that is—in my opinion—not as forthright as it could be (intentionally or not). Let’s level set a bit and talk a bit about the different flavors of wiggle room:
Super Fast Hardware
Here’s a screenshot of a Lighthouse result from this morning, October 14th, 2021, run on an old MacBook Air (2012) using Chrome 86.

Here’s the same result on my MacBook Air (M1, 2020) using Chrome 94:

It’s incredible to me the variability effect that your hardware can have: from a 64 on Performance to a 94—that’s a thirty point swing!
As additional context, I built a project called Speedlify, which is a self-hosted dashboard for performance monitoring and comparison. We use it on the Eleventy Leaderboards.
Speedlify has two common modes of operation: on a hosted CI/CD server or in DIY mode on your local machine. These two methods often provide different Performance scores! Running on a hosted server is typically more resource constrained and is more challenging to score well in Lighthouse’s Performance category.
For disclosure purposes, the Eleventy Leaderboards run in DIY mode primarily because the scale of the number of sites tested goes well beyond the build-time limit of the build server—but that does also mean that the scores are likely higher than if we were to able to run the project in hosted mode.
Normal Statistical Variability
Network conditions can vary. Maybe your computer was doing a resource intensive task while you were completing your test. Here are two additional runs of the same site on my MacBook Air (M1, 2020) using Chrome 94. It’s notable that these results offer a slightly higher performance score compared to the first run above.


In Speedlify, we attempt to smooth out this issue by running each test multiple times (by default 3) and selecting the median run using an algorithm from Lighthouse based on First Contentful Paint, Time to Interactive, and Largest Contentful Paint.
Speedlify improvements sparked by a discussion on Twitter with Patrick Hulce, who works on Lighthouse.
Mobile versus Desktop
Mobile scores are more difficult to score a perfect 100, particularly in the performance category. As Andy Davies states, this is “by design as mobile uses a simulated slower network, and CPU.” Importantly, and as previously discussed, the performance conditions are relative to the hardware/software of the current machine.
When a user shares a screenshot of a perfect Four Hundo score, Lighthouse (as it stands) makes it impossible to visually distinguish whether or not that score was taken under the Mobile or Desktop mode.
For example, here’s two Lighthouse scores of the same site taken back-to-back on the same hardware. One is a mobile result and one is desktop (you can click through to see a broader view). Note that structurally the screenshots are the same.
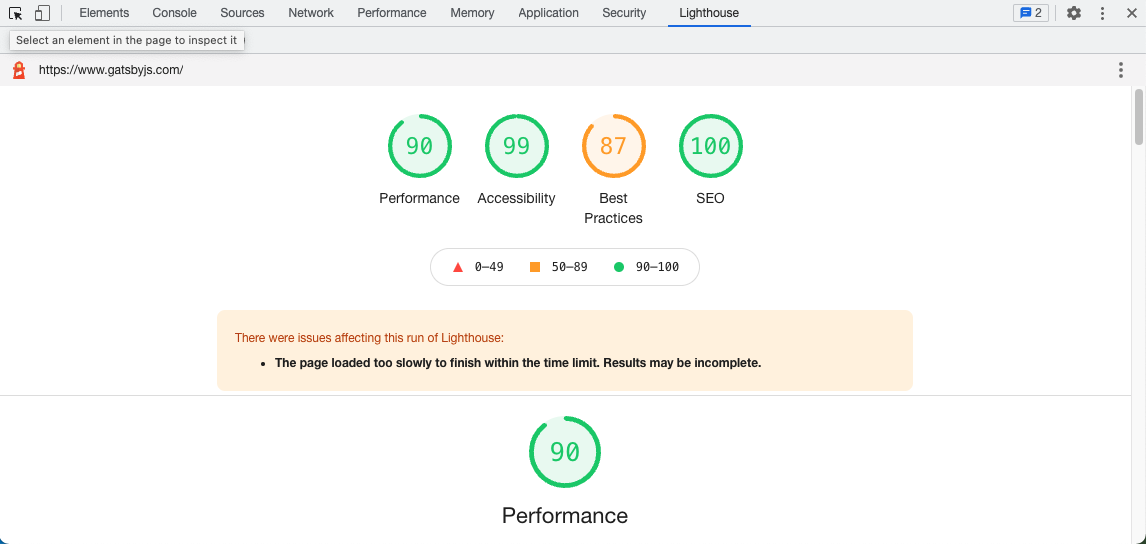
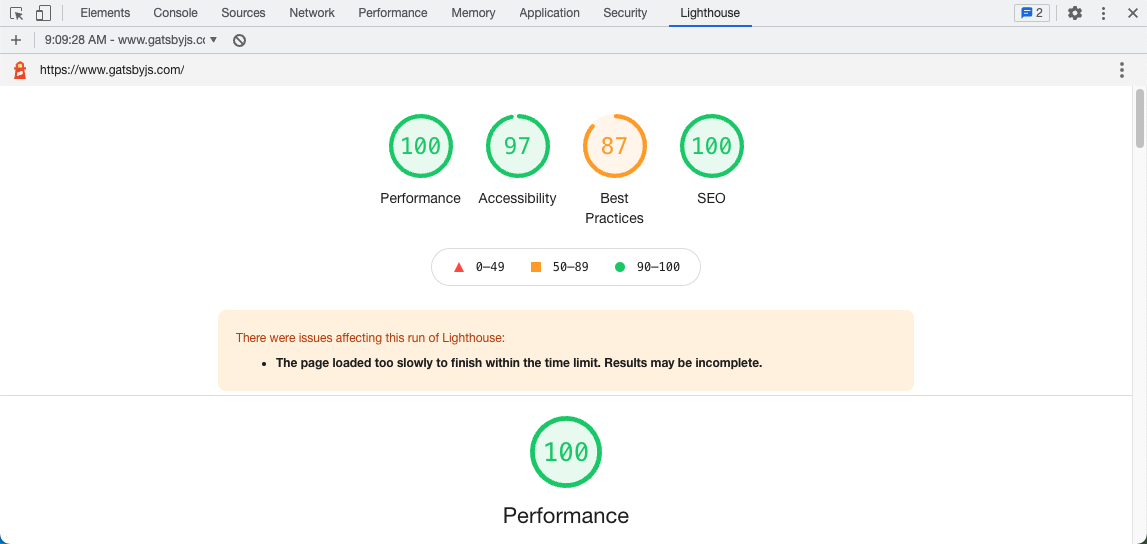
MacBook Air (M1, 2020) using Chrome 94.
There has been some discussion about adding a visual indicator to make the mode more obvious, which would help greatly!
Some more related Patrick Hulce discussion on Twitter.
I feel as though I should also mention—in a perfect world—if a web benchmark were to start from scratch with a new Lighthouse, the slow hardware simulation, network throttling, viewport size testing should be built into a single mode. I’d love it if the next version of Lighthouse ran Mobile mode, then Desktop mode, and displayed both scores together or combined them somehow. Get rid of the separation and it would clear up a bunch of the confusion in a very clean way.
Lab Data versus Field Data
This is perhaps the most nefarious distinction, because it is the most complex and as such offers the most effective kind of wiggle room: confusion.
Lab data is taken in a controlled environment. Field data is gathered from the recorded measurements of the performance of real visitors. Related: Why lab and field data can be different (and what to do about it).
Most of the methods we’ve talked about so far are only reporting lab data. But having field data is great, too! The caution I’d offer here is when someone focuses too closely on Field Data and never mentions Lab Data. But why? Isn’t it better to measure the real world? Why does it matter what happens in the lab?
Let us consult this classic blog post from Chris Zacharias: Page Weight Matters, in which Chris discusses a case study on the YouTube web site in which they decreased the page weight and the measured field data results got worse!
I had decreased the total page weight and number of requests to a tenth of what they were previously and somehow the numbers were showing that it was taking LONGER
Correspondingly, entire populations of people simply could not use YouTube because it took too long to see anything.
Large numbers of people who were previously unable to use YouTube before were suddenly able to.
If you have great field data: you may exist in the same realm as pre-optimized YouTube! The point being is that takes a holistic view of both field data and lab data to make good performance decisions!
Another way to say it:
- If your field data is good and your lab data is bad, you may have built yourself a site for the wealthy western web.
- If your field data is bad and your lab data is good (and assuming you aren’t doing any of the things we discussed to fudge your lab data scores), don’t fret! Your world wide web site may be reaching a global audience!
- If you have both good field data and good lab data then you are a unicorn—I applaud you and celebrate your success. I love that for you. Please share how you successfully banished your third-party JavaScript to the shadow realm.
Conclusion
You might walk away from this article thinking: wow, Lighthouse scoring could be improved! I agree, but I also think that it’s been a net-win for performance discussions with other stakeholders in a professional setting. I genuinely hope they solve the Performance variability problem and add visual indicators to show you the mode in which a test ran (Desktop or Mobile).
But mostly, this is a plea to y’all: please don’t game your Lighthouse score. I hope an increased awareness of these tricks will decrease the frequency at which we see them appear in the wild. Stay safe out there, y’all.


4 Comments
to answer your question, I would say I know some tricks I use to improve web performance as a site scales up in size and complexity — but drawing the line between changes to make a site faster or to game a system to make a score better is an ethics question, at its core
I do absolutely believe that metrics and scores help, if not only for launch but more importantly how the site performs over a longer period of time when dev resources are more scarce for maintenance
I might also point to some personal experiments I’ve been running on speedlify more recently: www.speedlify.dev/charts/ specifically the Lab versus Field LCP chart there
awesome! let me know if you have any more questions, happy to help